
Tags
I had an interesting exchange on Twitter yesterday with a top Tennis tipster who asked me whether it would be feasible for him to get involved in coding and Machine Learning in order to explore ML and Tennis modelling. The answer is of course yes but if you are starting from scratch there is a steep learning curve and you will have to invest time.
I advised him that their are non coding alternatives. For example you can explore ML models through the GUI interface that comes with WEKA
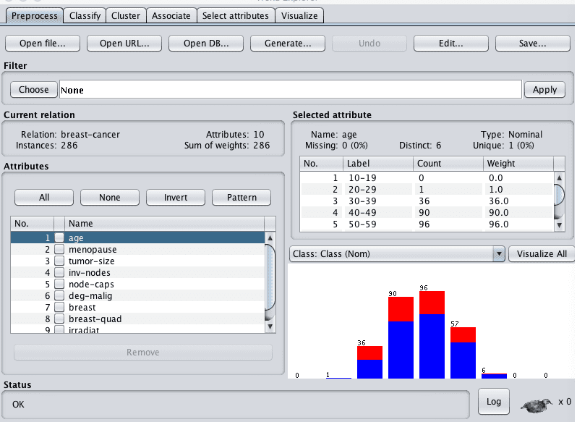
WEKA however does not provide profit and loss analysis which of course is important when we are building betting models. I suggested he try MySportsAI but it became clear to me that describing how to use MySportsAI for tennis modelling when it is primarily created for horse racing was a little difficult via Twitter messaging. In this blog I am going to demo how to lay out data and build a very simple model using Tennis data. It is not a profitable model, created only for demo purposes.
OK here is a screen shot of MySportsAI loaded up with some basic Tennis data
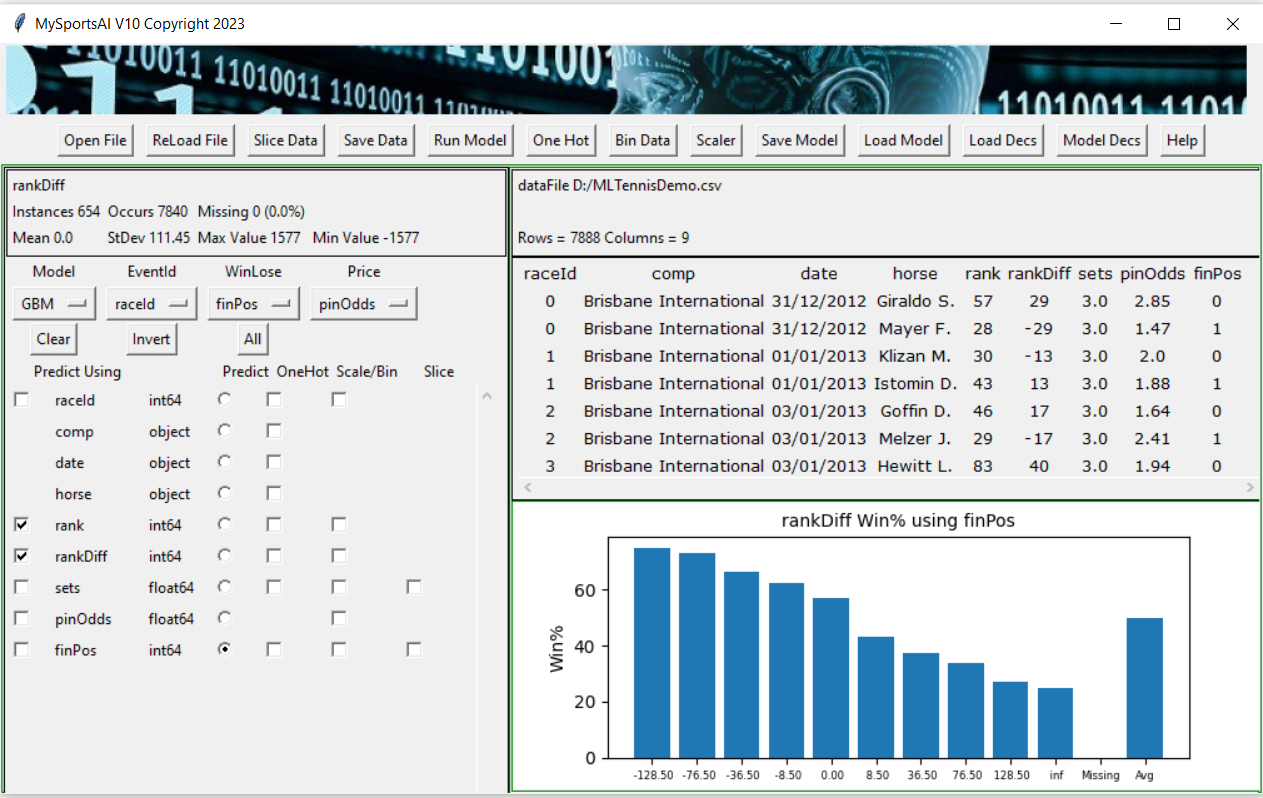
You will notice that the first 7 lines of this 7888 line data file are displayed on the upper right side. The first thin =g to notice is that the data has 2 lines per match. The other thing to notice is that I have labelled some of the columns rather oddly. For example the match ID is actually called raceId and the players are called horse. This is to allow MySportsAI to make sense of the columns or identify the columns when it outputs its results. I may make some changes to MySportsAI in future to alleviate this oddity but for now its a minor distraction, nothing more.
On the left we can see that there are 3 columns that we may want to use as inuts to our model namely rank, rankDiff and sets. For Tennis fans these terms should be obvious but if you are new to Tennis Giraldo is ranked 57 and Mayer 28. The rankDiff column is simply the rank difference of a player to his opponent.
pinOdds are the pinnacle closing line odds for the players and the finPos column designates with a 1 or a 0 who won the match. To the upper left I have made sure finPos and pinOdds are designated as the WinLose and Price features to be used by the model
There are a number of ML algorithms to choose from in the drop down list but I have chosen GBM.
Putting the cursor over a feature name or type will show on the lower right the frequency distribution or the win distribution respectively.
OK let us click ‘Run Model’ using rank and rankDiff as input features to produce the following window
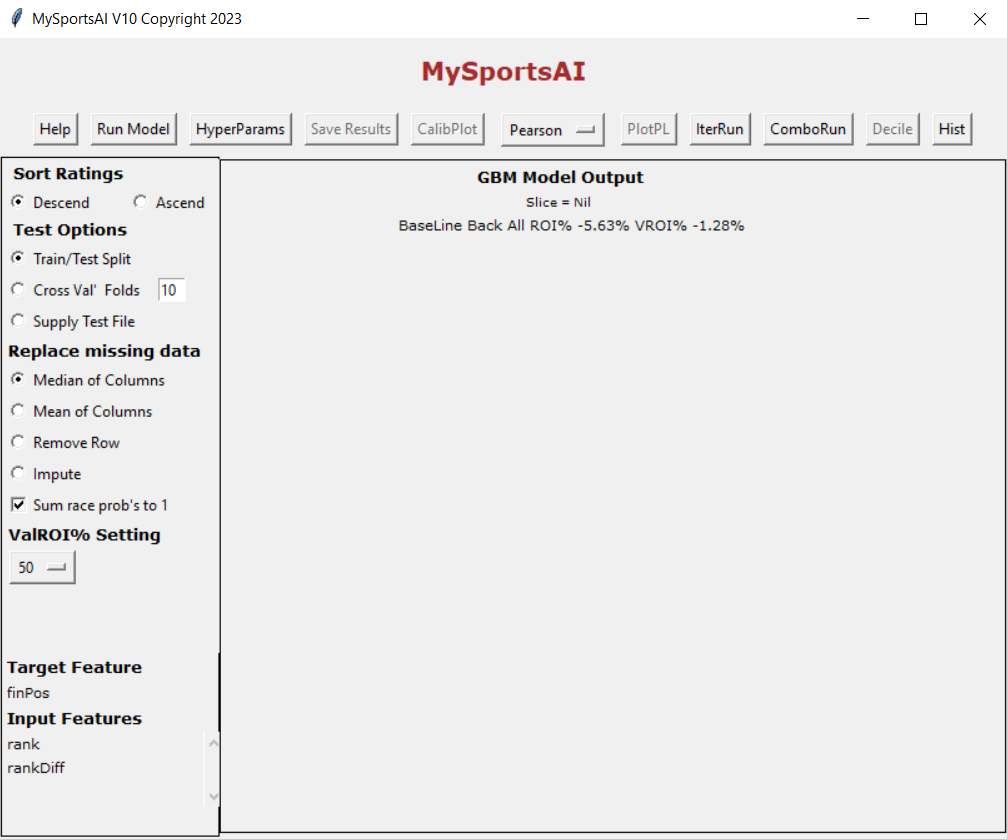
The train/test window appears. I have not yet created any results or a model even but first I need to set certain parameters. I am telling MySportsAI to organise the ratings it produces in descending order. We are going to perform a train/test split which simply means train the model on 80% of the data and then test the model it creates on the remaining 20%. I am also telling it to replace any missing data with the median of the column it resides in and finally sum the probabilities it produces to 1 for a given match.
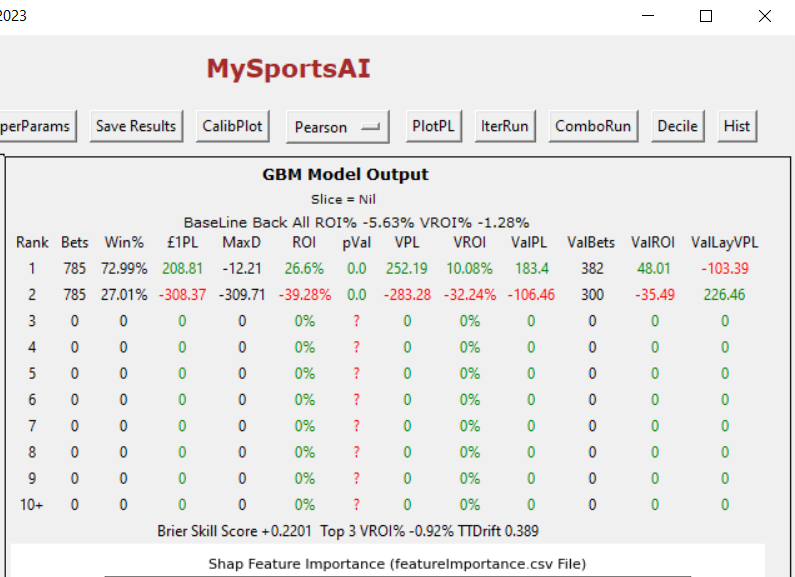
After clicking ‘run model’ in this window we get

We can see that the top rated player in each match made a loss of -23.15 whereas the second top lost -76.41. Backing to variable stakes (ie to win 1 point) lost you -10.3 on the top rated. rankDiff was the most important feature from the two features.
Clicking on Pearson from the top of the window produces
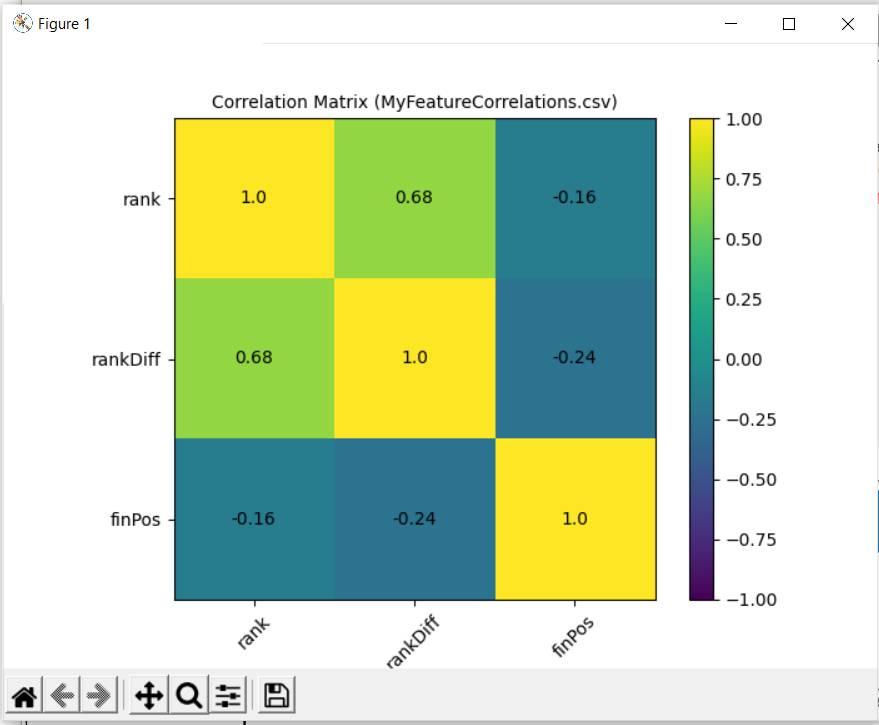
The correlation matrix confirms that rankDiff has a stronger correlation with finPos.
Would including the sets feature improve results ?

We have a slight improvement in the results although sets is the least important feature of the three.
MySportsAI allows you to then save the model so you can run it daily on data for todays matches.
This has been a brief overview of MySportsAI applied to Tennis. With more creative data it is possible to generate profit (see below)
If there is interest I may supply MySportsAI compatible Tennis data, but if you have data yourself and can manipulate data formats via code or Excel then you can plug in your own data.
