
Tags
All my blogs concerning Machine Learning have been about supervised learning. In other words giving the algorithm a set of results and asking it to find meaningful predictive patterns for a chosen set of input features. Unsupervised learning and in this blog I am talking about clustering, involves finding meaningful groupings within data.
An obvious application of clustering is trainer behaviour. Does a trainer perform well at this track or that track, what about if the horse has been laid off a long time. What if he has booked a top jockey etc etc.
Let me give you an example. Let us take a look at trainer performance in relation to how long it has been since a horse last run and how long between the last run and the penultimate run. I am going to look at flat handicaps from 2011 to 2019 and I will kick off by randomly choosing John Gosden (click on graph to enlarge).
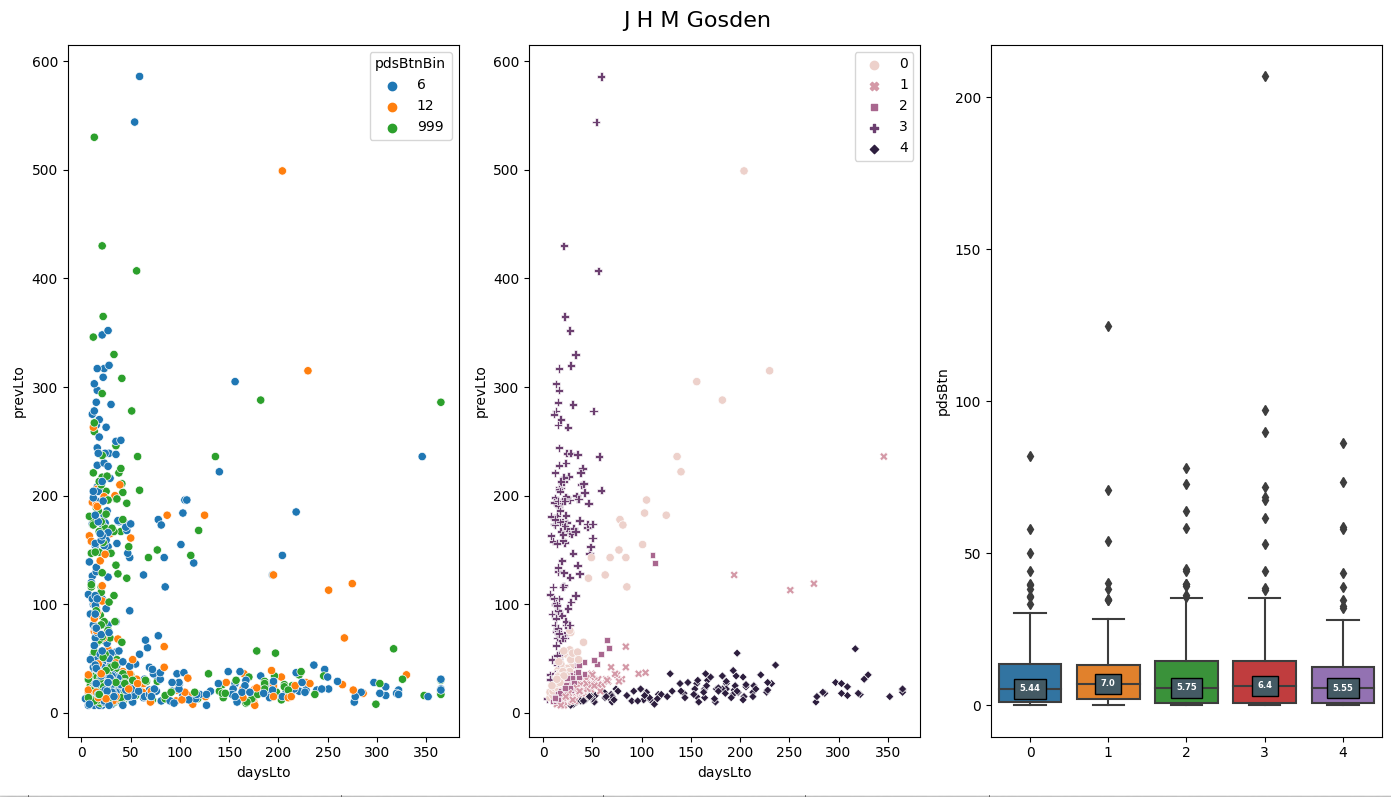
The left hand scatter plot shows us how 3 categories of run have performed for Gosden in relation to daysLto and prevLto. The blue dots are all runs that resulted in a winner or beaten less than 6lbs. The orange dots show all runs beaten between 6lbs and less than 12lbs and the green dots all other runs. The above represent a good run, an OK run and a poor run. We can modify these boundaries but for demonstration purposes they are fine.
The first plot does not tell us a great deal, we cannot really tell where Gosden performs best. The second plot shows the results of the cluster algorithm after it has split the runs into 5 different categories. We can see that the algorithm has identified runs with low prevLto and varying daysLto (dark diamonds category 4) through to low dayLto and varying prevLto (+ signs category 3) and 3 other categories in between. We can specify the number of categories but again for demo purposes 5 will do.
The final box plot shows the performance in terms of pound beaten by the various categories. The line across the middle of the boxes is the median value. We can see that category 0 had the best performance being beaten by a median of 5.44 pounds. On the middle plot category 0 is where the daysLto and prevLto are roughly equal.
We are interested in profit however, maybe Gosden loses less blindly within a different category than category zero. Here is the plot with final box plot showing loss to variable stakes.

Now we can see that Gosden loses a median of -0.112 on each bet on his horses in categories 1 and 3. Category 1 is still in that narrow band where both race gaps are similar but he appears to do well when the prevLto ranges upwards. Looking at Gosden second run up after a layoff may be worth investigating.
Kevin Ryan on the other hand does not do so well with horses in category 3, he is best in category 1 ie 2 equidistant runs in terms of time.

As I mentioned we can refine the number of clusters to search for and we are not restricted to these 2 input features (daysLto and prevLto)
Trainer analysis via clustering will be available in MySportsAI
Comment welcome and don’t forget to rate the article below
